
This is an old revision of the document!
Table of Contents
Hepatocellular carcinoma
Objectives
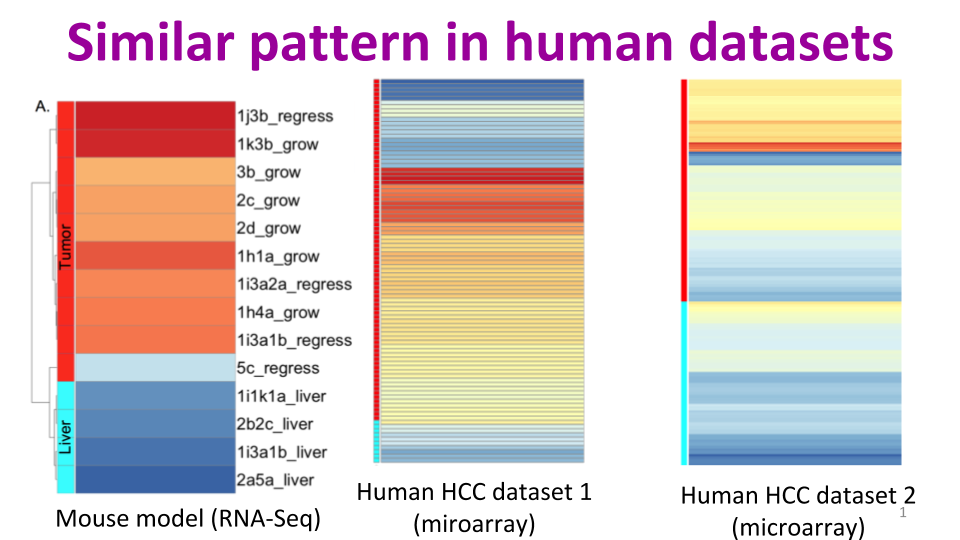
Hepatocellular carcinoma (HCC) is a the most common type of liver cancer and the third leading cause of cancer deaths in the world. The goal of project one is to identify the genes that are associated with regressing tumors (regardless of type of treatment) vs. those that are growing from the C3HeB/FeJ mouse model. Normal liver is used as a control. The results will be useful in identifying new therapeutic targets and potential drug combinations which could lead to more efficient treatments. Project two is related to knockdown of a specific protein that results in HCC in a different mouse model. The goal in the second project is to identify the genes and pathways that correlate with this protein.
Data
- RNAseq from liver of 9 treated and 4 control samples (Christi's data).
- Alternatively, we can map to the mouse reference transcriptome (NCBI37/mm9, rna.fa), and simplify the analysis in expense of losing upto 7% of reads.
- Ron Walter's lab ran their pipeline to filter the fastq data. These files are stored in folder called Filtered_fastq_files. From Will Boswell: “PE stands for paired end reads. For example, you have a 500bp fragment and your target sequence size is 125bp. The fragment will be sequenced 125 bases from one end and 125 bases from the other end, and Illumina refers to this as paired end reads. SE stands for single end reads, which in our case is generated during our filtering process. If you look at the pre-filtered reads, you’ll see only PE1 and PE2 for each sample. During filtration, if one of the PE’s have low quality, it is tossed out leaving the other PE, and since it no longer has a mate pair, it’s kept as a single end sequence. Also, there are several files in the post-filtered directories that are considered intermediate files in the filtering process that we don’t need; these are process files used by the filtering script. The only files you should be concerned with are the _pe1.r.fastq, _pe2.r.fastq, _se.r.fastq, and _PE.filter.stats (gives you the number of reads mapped to the genome for each PE and SE).” A summary of the analysis can be found here.
- Sequencing was completed by Beckman Coulter using TruSeq RNA Library Preparation Kit v2 which is an unstranded protocol.
- Jielei provided TruSeq Stranded RNA-Seq data from 8 mice in August 2017 (See ~/proj/hcc/data/TPT1/readme.txt), which was analyzed using TruSeq Stranded RNA-Seq.
**Sources of Human HCC RNA-seq Data**
- GSE25599 - 10 match-paired HBV-related Chinese HCC and non-cancerous adjacent tissues. Identified 1,378 significantly DE genes.
- GSE33294 - Chinese HBV-related hepatocellular carcinoma, paired tumor and non-cancerous adjacent tissues from 3 patients.
- GSE59259 - Alcohol-related HCC 8 paired samples of liver and HCC
- SRA074279 - 9 Chinese patients: paired HCC and adjacent non-cancerous tissues; Publication
- GSE55759 - Paired HCC and non-cancerous adjacent tissue; median of 7019 DE genes per set, 93 DE genes shared by 6/8 patients
| Sex/Age | Viral Infection | Tumor Differentiation | No. of Tumors | Vascular Invasion | TNM* Stage |
| M/62 | HBV(-)HCV(-) | Well | 1 | No | II |
| F/29 | HBV(+)HCV(-) | Well | 1 | No | II |
| M/56 | HBV(+)HCV(-) | Moderately | | No | II |
| M/55 | HBV(+)HCV(-) | Moderately | 1 | No | II |
| F/39 | HBV(+)HCV(-) | Moderately | 1 | No | II |
| M/44 | HBV(+)HCV(-) | Moderately | 1 | Yes | III |
| M/47 | HBV(+)HCV(-) | Moderately | 1 | No | II |
| M/48 | HBV(+)HCV(-) | Poorly | 1 | Yes | III |
Collaborators
Drs. Christi Walter and Lily Dong from the Department of Structural and Cellular Biology at UT Health Science Center in San Antonio.
Analysis
Project 1:
- Uploading RNAseq data to Maverick: Jessica's lab notebook, 2015/12/15.
- Mapping reads and de analysis: Habil's lab notebook, 2015/12/16.
- Mapping gene names: Amir's lab notebook, 1/10/2016.
- Computing eigengen: Habil's lab notebook, 2016/01/27
- Comparing de genes with human databases: Jessica's lab notebook, 2016/2/4.
- The comparison of Will's DE analysis and ours: Jessica's lab notebook, 2016/2/4.
- PCA: Jessica's lab notebook, 2016/5/31.
Publication:
Jessica Zavadil, Maryanne Herzig, Kim Hildreth, Amir Foroushani, William Boswell, Ronald Walter, Robert Reddick, Hugh White, Habil Zare. C3HeB/FeJ Mice Mimic Gene Expression and Pathobiological Features of Human Hepatocellular Carcinoma, Molecular Carcinogenesis, In press.
Project 2:
- Habil cleaned and mapped Lilyi's data on 2017/08/10 (lano).
- Hanie did DE analysis on mapped transcripts on 2017/08/14 (lano)
Related work
- Hoenerhoff, Mark J., et al. “Global Gene Profiling of Spontaneous Hepatocellular Carcinoma in B6C3F1 Mice Similarities in the Molecular Landscape with Human Liver Cancer.” Toxicologic pathology 39.4 (2011): 678-699.
Microarray analysis of tumors from B6C3F1 mice (first generation of C57B/L6J and C3HeB/FeJ strains) - Keane, Thomas M., et al. “Mouse genomic variation and its effect on phenotypes and gene regulation.” Nature 477.7364 (2011): 289-294.
Compared the standard reference genomes of mouse (C57BL/6J) with other strains. - Munger, Steven C., et al. “RNA-Seq alignment to individualized genomes improves transcript abundance estimates in multiparent populations.”Genetics 198.1 (2014): 59-73.
Proposed a method for strain-specific alignment and compared with mapping RNAseq data from a strain to the reference genome. Observed >10% change in expression in about 2,000 genes. - Huang, Shunping, et al. “Transforming genomes using MOD files with applications.” Proceedings of the International Conference on Bioinformatics, Computational Biology and Biomedical Informatics. ACM, 2013.
Figure 4 shows that if we map to reference genome, we may loose not more than 7% of reads. - Hart, Steven N., et al. “Calculating sample size estimates for RNA sequencing data.” Journal of Computational Biology 20.12 (2013): 970-978.Wu, Hao, Chi Wang, and Zhijin Wu. “PROPER: comprehensive power evaluation for differential expression using RNA-seq.” Bioinformatics 31.2 (2015): 233-241.From Fig2 and Fig3 of Huang et al. paper, and Fig5 of Hart et al., it seems that at least 5-7 samples are needed for each condition.
- Ching, Travers, Sijia Huang, and Lana X. Garmire. “Power analysis and sample size estimation for RNA-Seq differential expression.” rna 20.11 (2014): 1684-1696.
Related software
- TopHat, useful for aligning RNAseq data to a genome.
- StringTie, reconstructs transcriptom from RNAseq data (2015).
- Homer's quick tutorial on mapping NGS data using several tools including bowtie2, bwa, TopHAt, etc. with command line examples.
- Lefebvre's quick tutorial on RNA-Seq data analysis.
- Schiffthaler's ~1 hour video on RNA Seq data preprocessing including FastQC, sortmerna to exclude rRNA, trimmomatic to trim the adaptors and low quality bps, STAR to map reads to the genome, samtools to index the bam file, IGV to visualize the reads on the genome, and HTSeq to count the number of reads mapped to each gene (coverage). These are all steps we need to do before differential analysis using, say DESeq2. This is a textual version explaining the same steps.